
Beer Colour Analysis
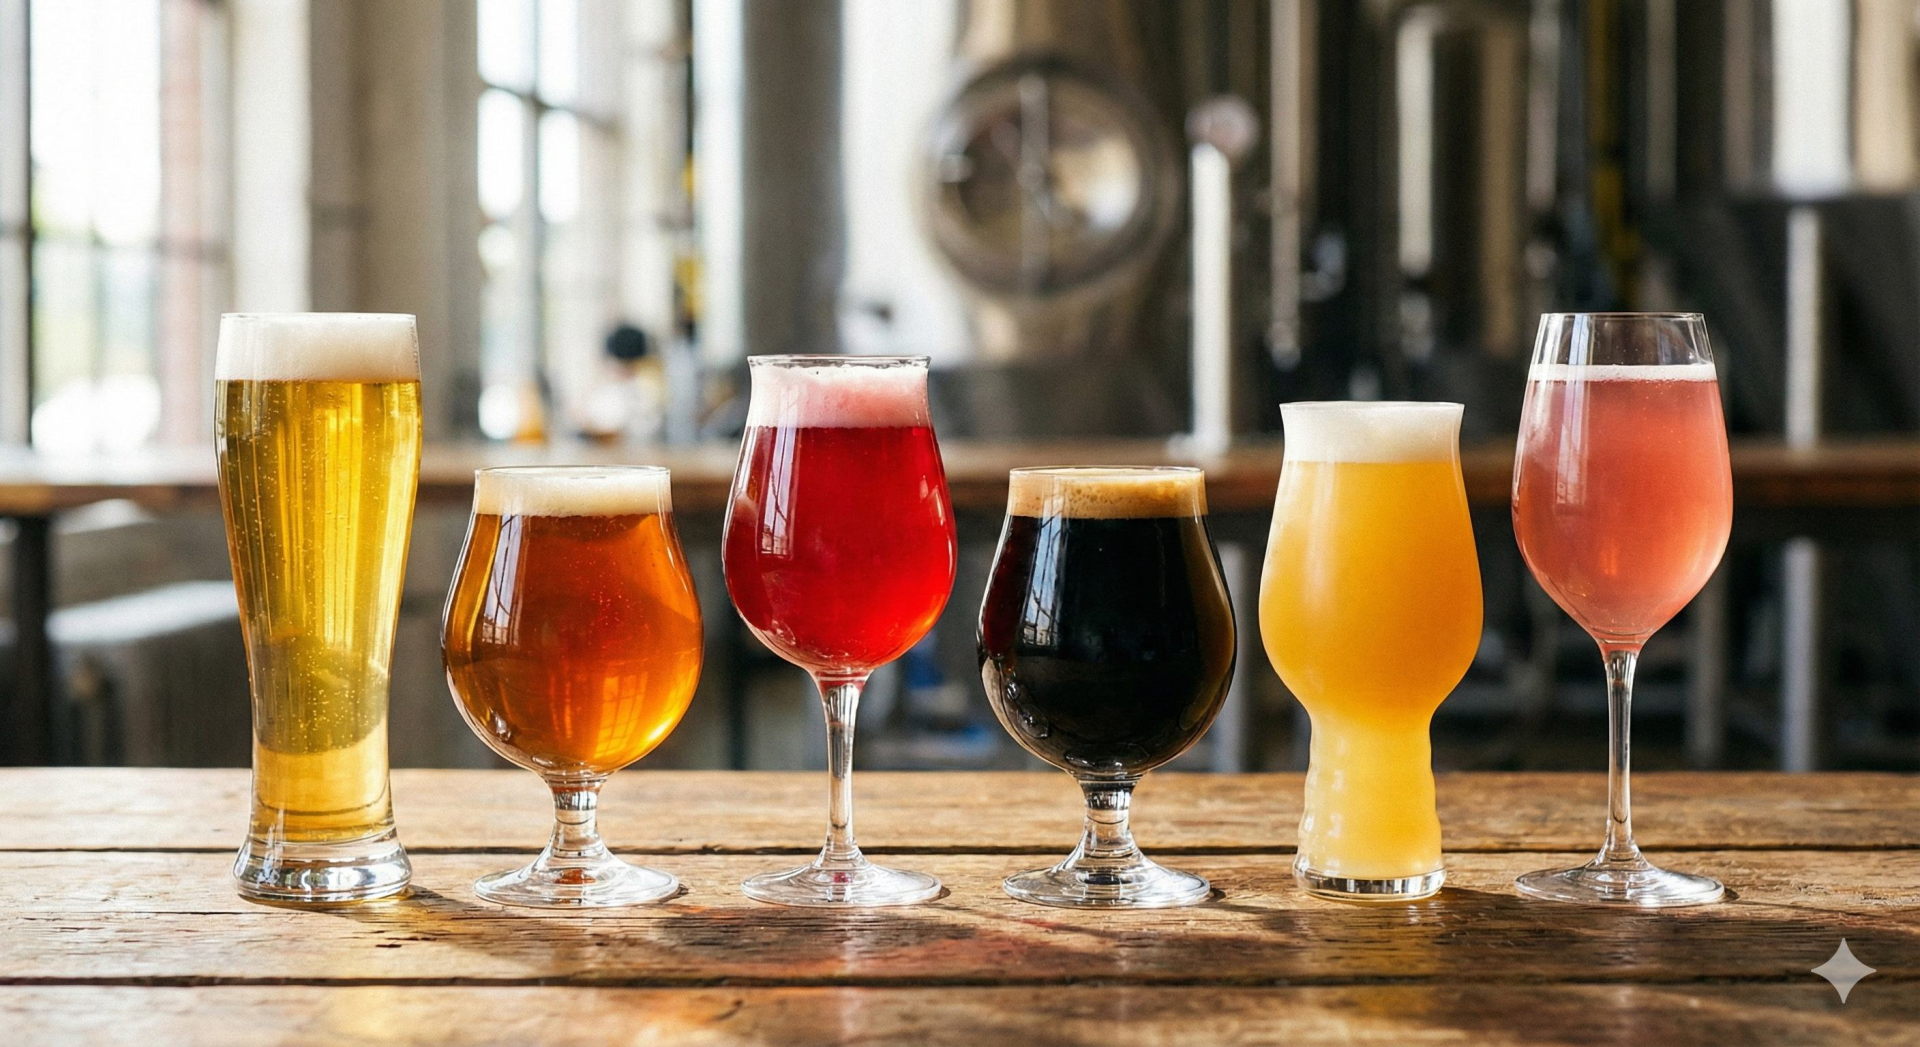
Beer colour analysis requires consistent, repeatable measurement across production batches to verify authenticity and quality. The OPTIZEN Alpha UV-Vis double beam spectrophotometer measures beer absorbance at 430 nm and 700 nm wavelengths, enabling calculation of colour values by both EBC (European Brewery Convention) and ASBC (American Society of Brewing Chemists) methods. Three representative beer samples yielded EBC colour values between 9.2 and 28.9, with ASBC colour values between 4.7 and 14.7, demonstrating accurate differentiation across light, amber, and dark beer styles.
Introduction
Beer is one of the most popular alcoholic beverages and has produced a large-scale industry worldwide. Beers have an expansive range of variety which resulted in the requirement of quality control to ensure safety, authenticity, and distinct flavours as claimed by different manufacturers. Although sensory evaluation is an age old and essential technique in this regard, systematic analysis involving analytical instruments like UV-Vis spectrophotometer safeguards uniform quality across multiple batches of beers.
The standard international methods for sensory analysis of beer are the methods of the American Society of Brewing Chemists (ASBC) and the European Brewery Convention (EBC), and in Japan, the Brewery Convention of Japan (BCOJ), focussing on major beer producers, has established analytical methods for beer. This application note includes analysis of colour of various beer samples as specified by ASBC and EBC methods by an OPTIZEN Alpha double beam spectrophotometer.
Materials and Method
Samples and Reagents
- Representative beer samples
Instrument and Accessories
- Alpha double beam spectrophotometer
- 10 mm standard cuvettes (disposable types can also be used)
- Membrane filter (≤ 0.45 μm)
- Ultrasonic bath
- Erlenmeyer flask
- Aluminium foil
Measurement Procedure
Sample Preparation
A 50 ml beer sample is taken in an Erlenmeyer flask, and covered with aluminium foil. It is then ultrasonicated for about 20 minutes for decarbonation. A 10 mm standard cuvette is filled with the decarbonated beer sample. The absorbance of the beer sample is measured at 430 nm and 700 nm wavelength.
Measurement Parameters and Data Analysis
If Absorbance at 430 nm (A430) is greater than 0.8, then the sample has to be diluted at least three times of distilled water or more. The dilution factor will have to be calculated during the final calculation.
The absorbance at 700 nm (A700) should be less than the value of 0.039 × A430. If not, then the sample is considered to be too turbid and has to be filtered at least three times before measuring again at the same wavelength.
When the aforementioned conditions are fulfilled, then the final calculation can be carried out.
EBC Colour: 25 × A430 × dilution factor
ASBC Colour: 12.7 × A430 × dilution factor
Result
Table 1. Beer Colour Analysis Results
| Beer Sample | Parameter | Result |
|---|---|---|
| Sample 1 | EBC Colour | 20.7 |
| ASBC Colour | 10.5 | |
| Sample 2 | EBC Colour | 9.2 |
| ASBC Colour | 4.7 | |
| Sample 3 | EBC Colour | 28.9 |
| ASBC Colour | 14.7 |
The beer colour analysis was successfully conducted by the Alpha UV-Vis spectrophotometer across three representative beer samples. Sample 1 yielded EBC colour of 20.7 (ASBC: 10.5), Sample 2 yielded EBC colour of 9.2 (ASBC: 4.7), and Sample 3 yielded EBC colour of 28.9 (ASBC: 14.7). These results demonstrate the differentiation of light lager (Sample 2), amber ale (Sample 1), and dark beer (Sample 3) styles using standard EBC and ASBC calculation methods. The Alpha double beam spectrophotometer successfully resolved absorbance values at 430 nm and 700 nm wavelengths with sufficient precision to meet international brewing convention colour standards.
Conclusion
The beer colour analysis was successfully conducted by the Alpha UV-Vis spectrophotometer.
References
- EBC (European Brewery Convention) Method, vol. 73, 1967.
- ASBC (American Society of Brewing Chemists) methods.