
ASTA Color Analysis of Red Pepper Powder Using the Alpha UV-Vis Spectrophotometer
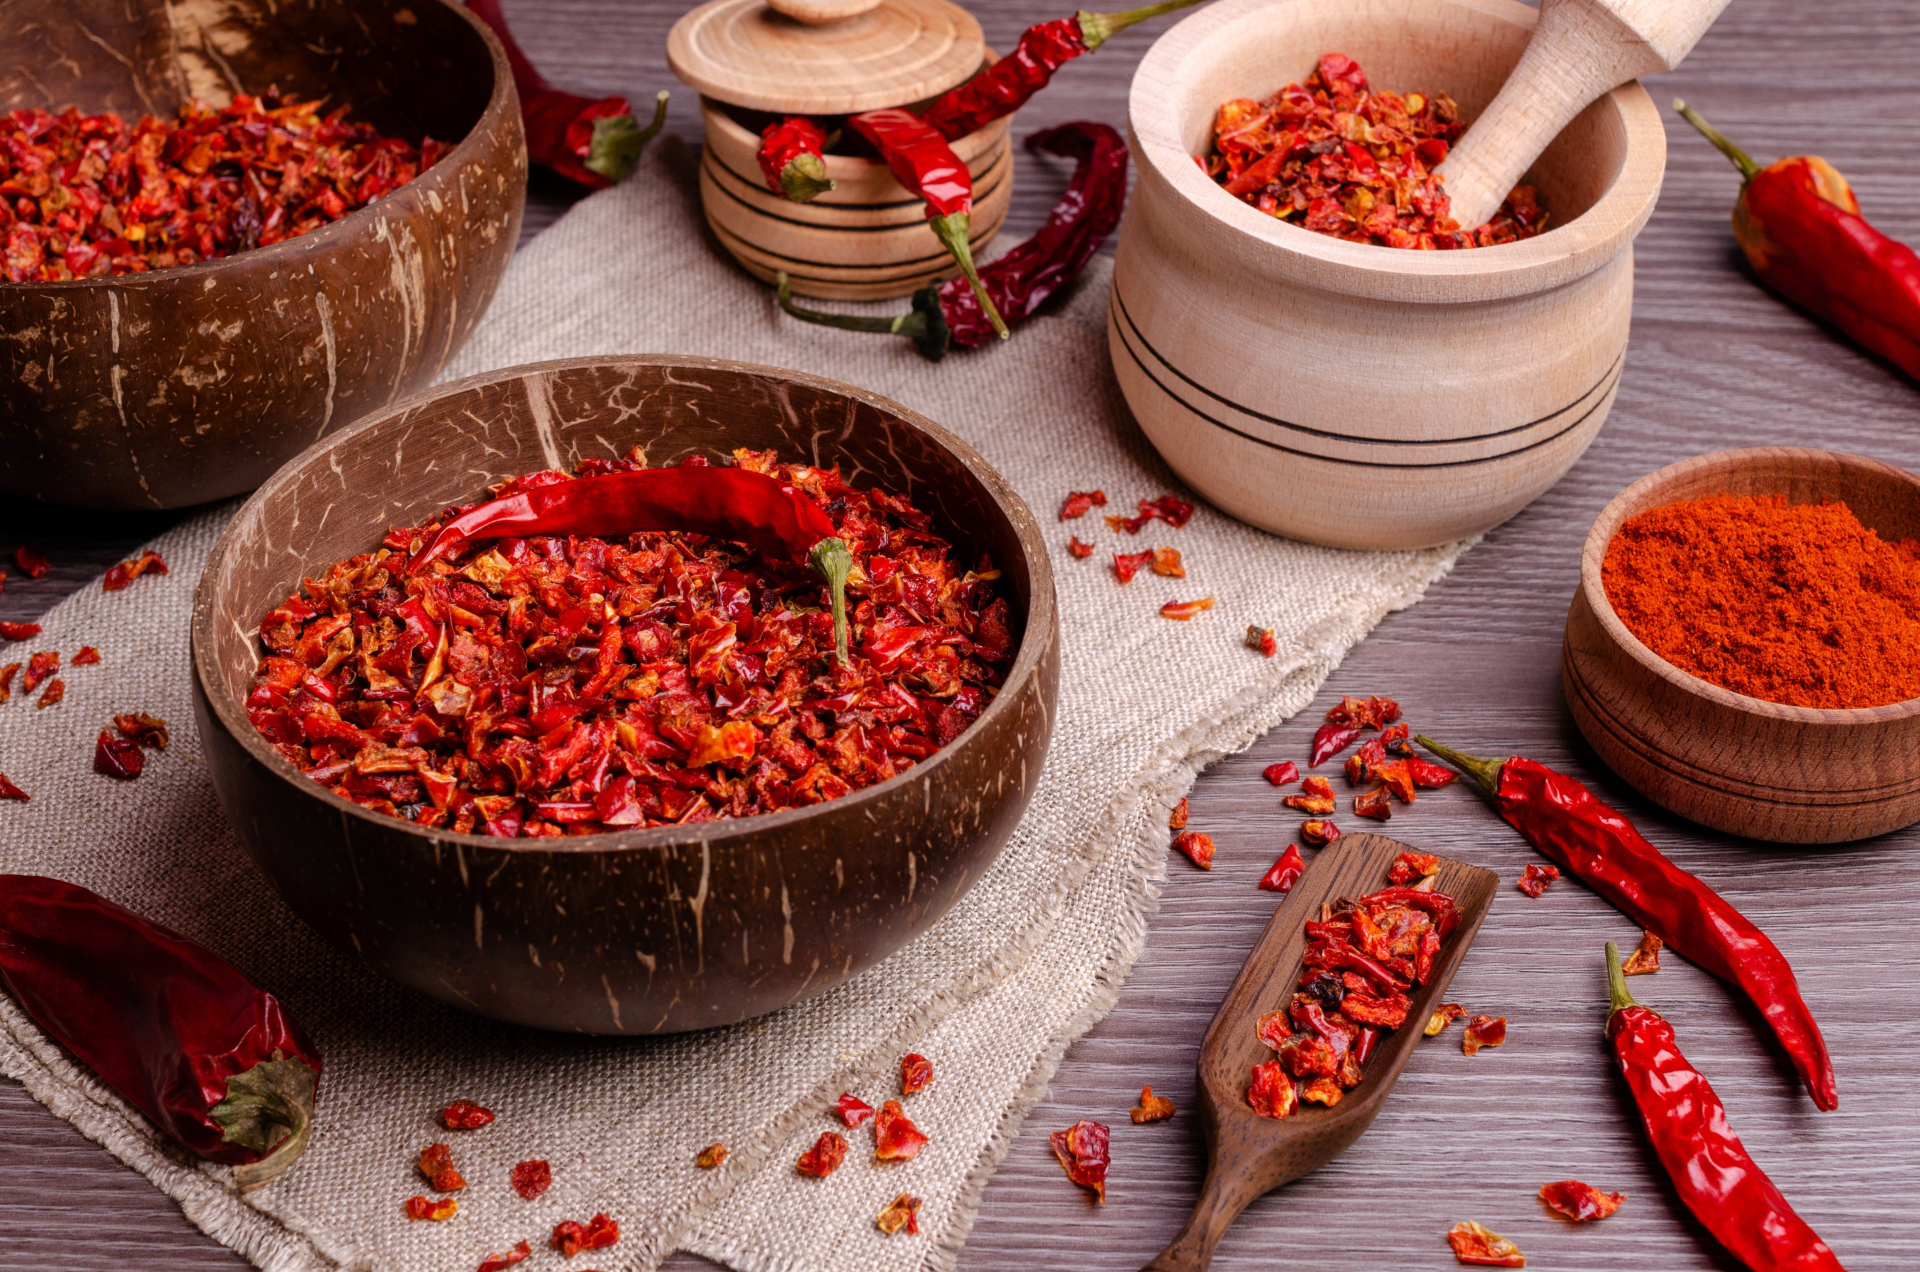
This application note provides a practical demonstration of red pepper color evaluation using the ASTA Method 20.1 with K LAB’s Alpha UV-Vis Spectrophotometer. The method relies on a simple acetone extraction and single-wavelength absorbance measurement at 460 nm, enabling efficient comparison of color intensity across different red pepper samples. By applying this standardized approach, the study highlights the Alpha UV-Vis’s capability to deliver reliable, consistent, and reproducible ASTA Color values.
Introduction
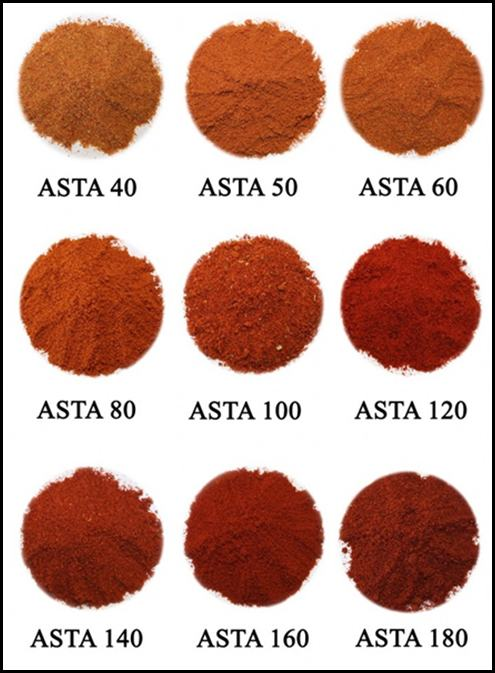
Red pepper powder is widely used in various foods such as kimchi, gochujang (Korean red pepper paste), and seasoning mixes, with color serving as a key indicator of quality.
While methods such as HPLC and TLC can be used to analyze pigment components in red pepper, they have limitations due to complex sample preparation, lengthy analysis time, and high cost.
In contrast, the ASTA (American Spice Trade Association) Method 20.1 is a standardized analytical method that quantifies color by extracting pigments with acetone and measuring absorbance at 460 nm using a UV-Vis Spectrophotometer. It is widely used for comparing the color of multiple samples without requiring complex separation procedures.
This application note presents an ASTA Color analysis of red pepper powder based on ASTA Method 20.1 using K LAB’s Alpha UV-Vis spectrophotometer and evaluates the instrument’s applicability and analytical reproducibility.
Experimental Conditions
1. Equipment Used
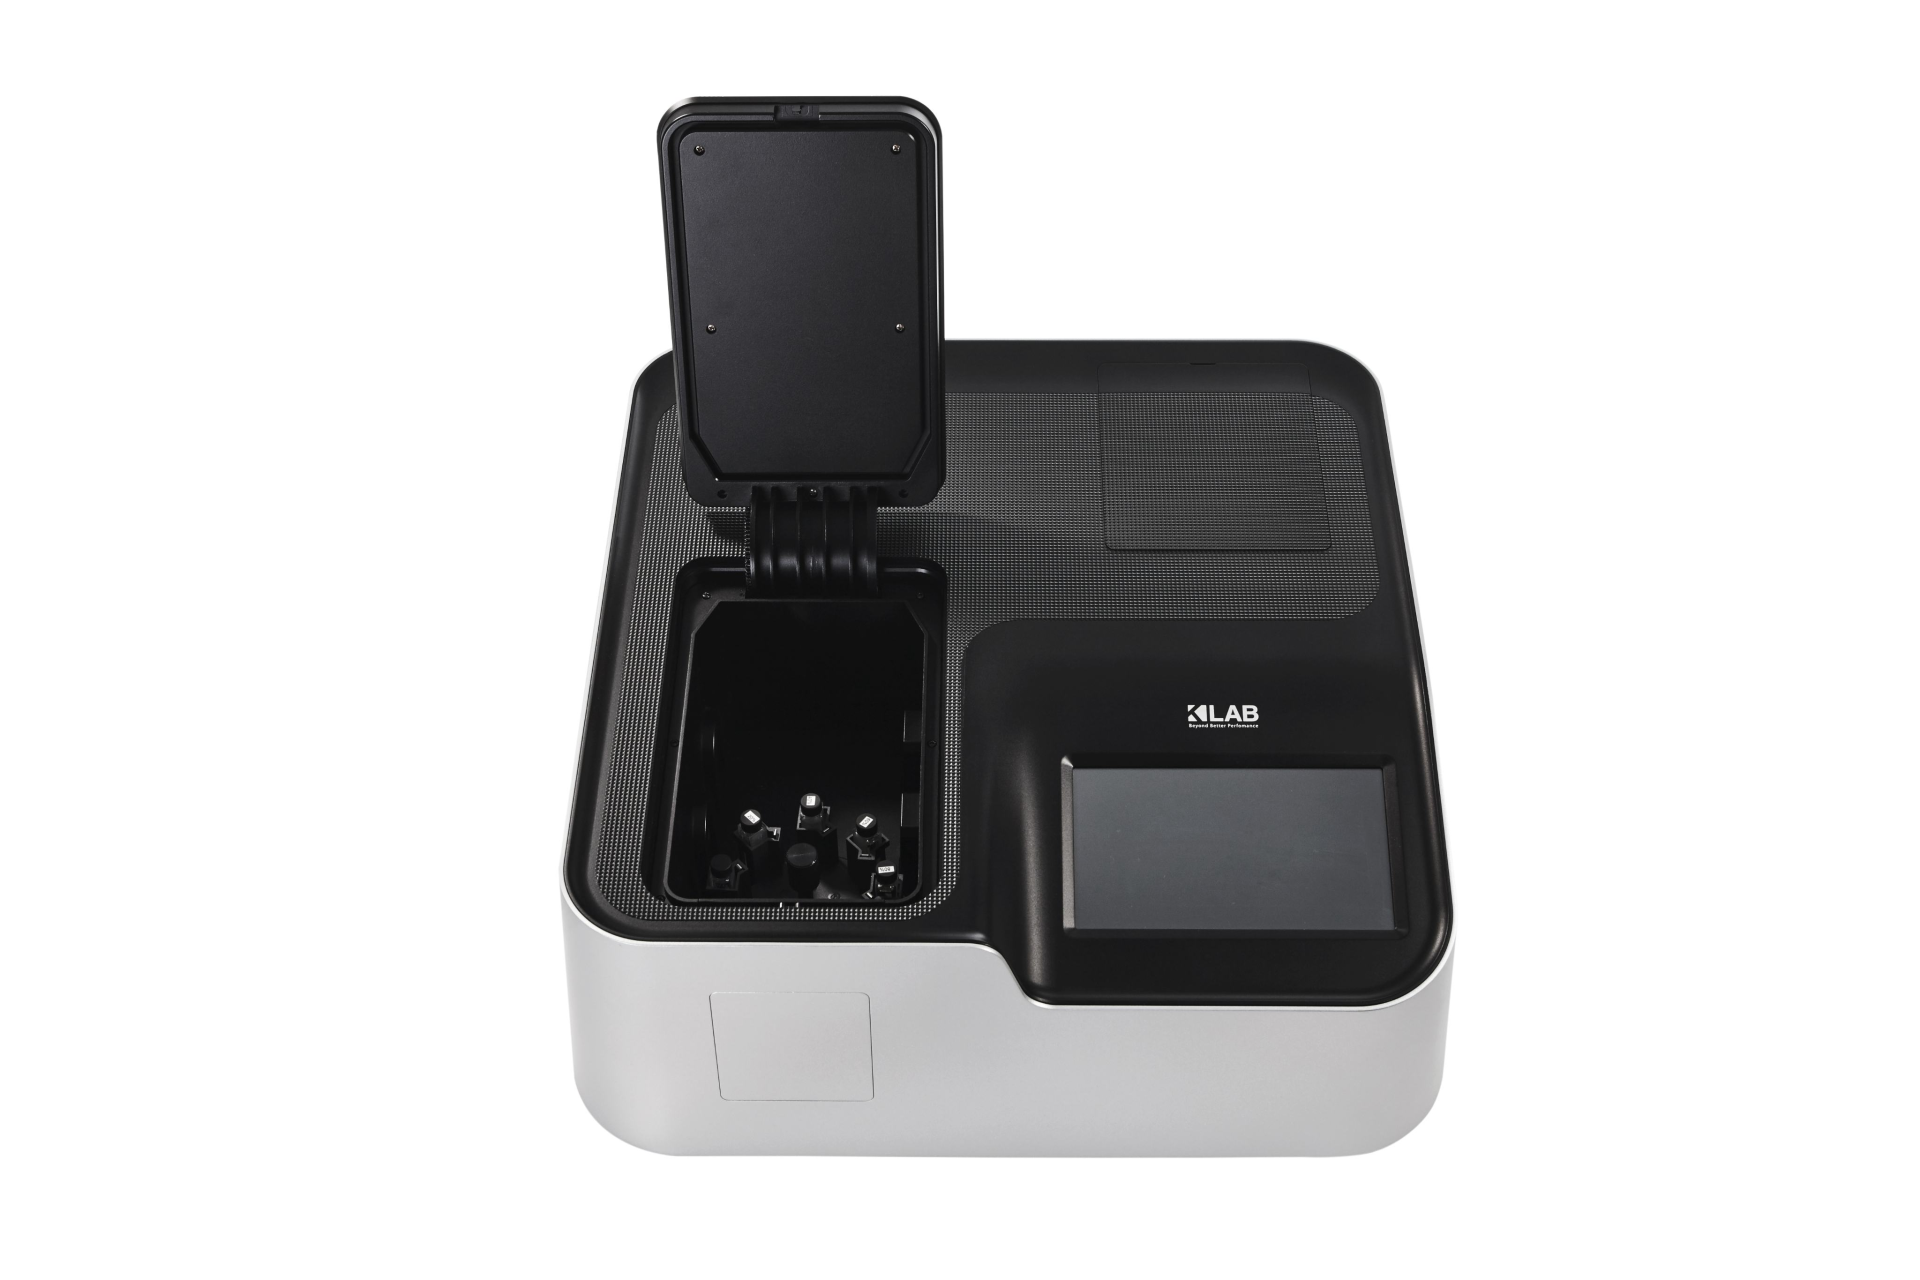
- Alpha UV-Vis Spectrophotometer (K LAB)
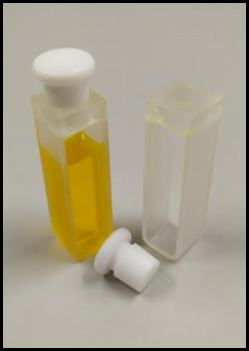
- 10 mm Quartz Cuvette (with Stopper)
- 100 mL Volumetric Flasks with ground glass stoppers
- Analytical balance readable to 0.1 mg
- 10 mL Class A transfer pipettes
2. Reagent and Standards
- Acetone, ACS grade
- Glass Reference Filter
▶ Filter Used: Starna Scientific Ltd. (Serial No. 120108), certified absorbance of 0.5237 at 465 nm
▶ ASTA Method 20.1 guideline: A glass filter such as NIST SRM 2030 or 930 with an absorbance in the range of 0.4 – 0.6 at 465 nm is recommended for calculating the Instrument Correction Factor
3. Sample
A commercially available red pepper powder sample randomly selected from domestic distribution
Experimental Procedure
1. Instrument Correction Factor (If) Verification
ASTA Method 20.1 includes an optional procedure for verifying the accuracy of the spectrophotometer by calculating the Instrument Correction Factor (If), using a certified glass filter with an absorbance value between 0.4 and 0.6 at 465 nm, as specified by NIST.
In this experiment, a glass filter with a certified absorbance of 0.5237 at 465 nm was used as the reference. The If was calculated using Equation 1.
If = NIST Certified Absorbance (at 465 nm) / (Measured Absorbance (at 465 nm))
Equation 1. Calculation of Instrument Correction Factor (If)
2. Pigment Extraction
- Accurately weigh the red pepper powder sample in the range of 0.0700 g to 0.1000 g, and transfer it to a 100 mL volumetric flask.
※ The weighed value must be recorded precisely, as it is used in the ASTA Color calculation.
- Fill the flask with acetone to the mark, seal it with a stopper, mix thoroughly, and allow the mixture to stand in the dark for at least 16 hours for pigment extraction.
- After extraction, use only the supernatant by filtration or natural sedimentation.
- If the absorbance is expected to exceed 0.70, prepare an additional 1:2 diluted sample using acetone.
3. Measurement and Result Calculation
- Transfer at least 3 mL of the extracted solution into a 10 mm quartz cuvette for measurement.
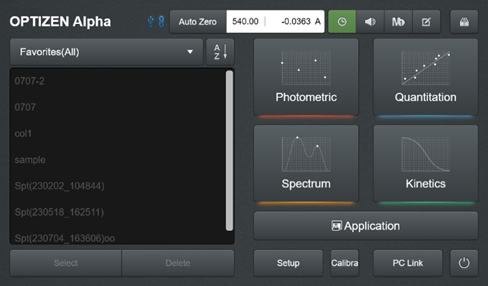
- Select the Photometric Mode on the Alpha UV-Vis spectrophotometer and measure the absorbance at 460 nm.
※ If the absorbance exceeds 0.70, dilute the sample to half concentration with acetone. If it is below 0.30, discard the extract and repeat the extraction using a larger sample amount.
- Calculate the ASTA Color value using the formula in Equation 2.
ASTA Color = Absorbance (at 460 nm) / Sample weight (g) × If
Equation 2. ASTA Color calculation formula.
Results
1. Instrument Correction Factor (If) Results
A certified glass filter (Strana Scientific, Serial No. 120108) with an absorbance of 0.5237 (at 465 nm) was measured 10 times. The average absorbance was 0.5239, and the coefficient of variation (%CV) was 0.01%.
Based on Equation 1, the calculated Instrument Correction Factor (If) was 1.000, confirming that no additional correction was required for the experiment.
Table 1. Instrument Correction Factor Measurement Results
| Certified Absorbance | 0.5237 |
| Average Absorbance | 0.5239 |
| Standard Deviation | 0.00003 |
| Coefficient of Variation (%CV) | 0.01% |
| If | 1.000 |
2. ASTA Color Results
Triplicate measurements were conducted on both the undiluted paprika sample and the 1/2 dilution sample. ASTA Color values were calculated using Equation 2.
The average absorbance of the undiluted sample was 0.9359, exceeding the recommended absorbance range (0.30 – 0.70) specified in ASTA Method 20.1. Therefore, this data was considered unreliable and excluded from the final evaluation.
The 1/2 dilution sample showed an average absorbance (at 460 nm) of 0.4690, which falls within the acceptable range. The corresponding ASTA Color value was calculated as 152, and the coefficient of variation (%CV) was 3.2%, demonstrating excellent reproducibility compared to the general reference range of 5.9 – 7.8% specified in the ASTA Method.
Table 2. Summary of ASTA Color Measurement Results
| Dilution Condition | Avg. Absorbance (at 460 nm) | Avg. ASTA Color | Coefficient of variation (%CV) |
|---|---|---|---|
| Undiluted Sample | 0.9359 | 152 | 3.3 |
| 1/2 Diluted Sample | 0.4690 | 152 | 3.2 |
Conclusion
In this application note, the ASTA Color of red pepper powder was analyzed based on ASTA Method 20.1 using the Alpha UV-Vis spectrophotometer by K LAB.
Through the measurement of the Instrument Correction Factor, the instrument’s measurement stability was verified. The %CV of the triplicate measurement for the 1/2 diluted sample was 3.2%, which is better than the general %CV range (5.9 – 7.8%) suggested in ASTA Method 20.1, confirming excellent reproducibility.
These results demonstrate that the Alpha spectrophotometer is well suited for ASTA Color measurement and can serve as a reliable analytical tool for quality control and grade classification of red pepper powder in the food industry.
*Reference
– American Spice Trade Association (ASTA). ASTA Analytical Methods 20.1: Extractable Color in Capsicums and Their Oleoresins.